
By Johara Farhadieh
Chief Investment Officer
By Joe Halwax, CAIA, CIMA
Senior Managing Director, Institutional Investment Services
March 24, 2025
We wouldn’t fault readers if they rolled their eyes a bit at another investment-focused article centered on the “Magnificent 7.” It certainly feels like this group of stocks—the seven U.S. mega-cap technology names which have sharply outpaced the rest of the S&P 500 since early 2023—have dominated nearly every investor conversation for the past several years.
But bear with us—today, we’re taking a different approach to the Magnificent 7 discourse by looking at how the trend has impacted specific market mechanics, namely the concentration of these select names in equity indexes.
Annual Returns Since 2021 (Through February 28, 2025)
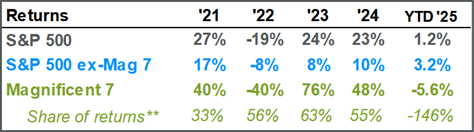
(Source: J.P. Morgan Asset Management)
As the U.S. mega-cap names have outperformed the broader market, their market capitalization (or “market cap”)—defined as the total value of a publicly traded company's outstanding common shares owned by stockholders—has increased. As a reminder, the majority of U.S. equity indexes are “market cap weighted,” while a smaller number are “equal weighted.”
Market Cap Weighted: The higher the market value of a company, the larger weighting that company has in the index. In other words, larger companies represent a higher proportion of the index.
Equal Weighted: As it sounds, an equal weighted index will hold all the stocks in the index at the same percentage or weighting.
So, as the mega-cap names have increased in market cap, their weighting in many investors’ indexes, such as the S&P 500, have also increased. This means an investor that owns an S&P 500 index fund now owns more of the large names—and less of the remaining companies. Here’s an example of how that works compared to an equal-weighted index:
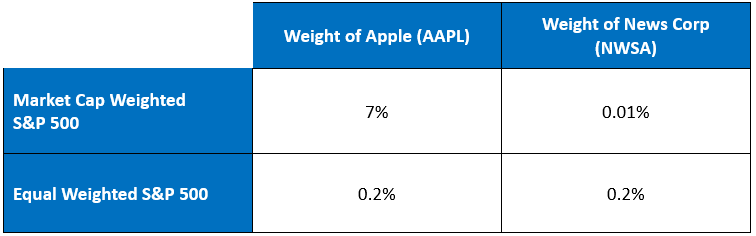
This example highlights two specific names that are held in sharply different weights when looking at a market cap weighted index versus an equal weighted index.
Turning to sectors, we can see that, over the past year, the S&P 500 equal weighted index held on average 18% less in Information Technology (Ex: Nvidia, Apple, Microsoft) and 5% less in Communication Services (Ex: Google, Meta, Netflix) versus the more popular cap-weighted S&P 500 index.
Average Weight Difference Over Past Year (Equal Weighted S&P 500 vs. S&P 500)
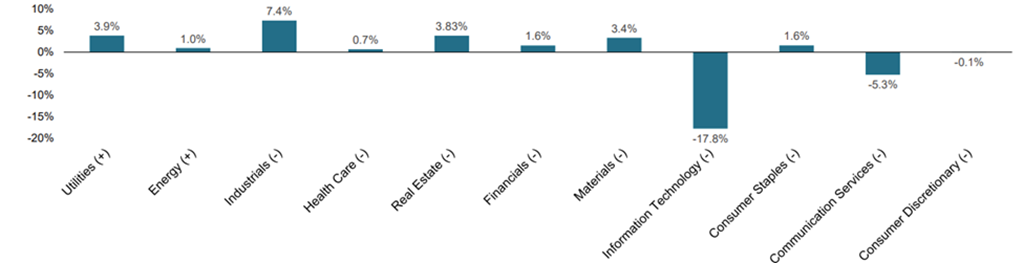
(Source: S&P Global, as of January 31, 2025)
Since 2021, and especially in 2023 and 2024, the top 10 names in the S&P 500 have outpaced the returns of the other 490 stocks. As a result, they have made up an increasingly large portion of the index—and are now at the highest level of concentration (36.4% of the total index) since the 1950s and 60s.
Weight of the Top 10 Stocks in the S&P 500
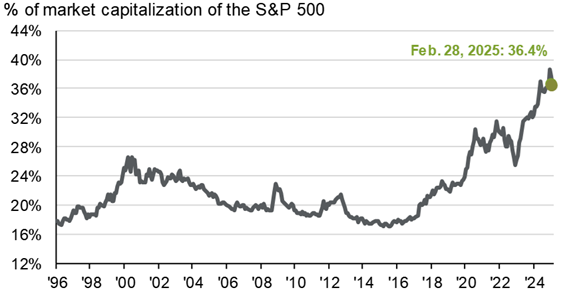
(Source: J.P. Morgan Asset Management)
Whether or not the concentration trend is a cause for concern for investors—particularly those holding index funds—has become the subject of some debate.
The arguments that increased concentration heightens the risk of holding the index are straightforward:
There are also good arguments that the risk from concentration is overstated:
Still, in the 1950s and 1960s, when markets saw similar concentration, passive investing was nonexistent, unlike today, where it accounts for a significant share of the U.S market. The market microstructure has changed, resulting in less liquidity due to the significant weights of these top names in popular U.S. indexes. This is beneficial when the market is rallying, but problematic during downturns, as there are fewer active managers to step in and buy. The August 2024 volatility in equities, influenced by the Yen carry trade move, and the recent tariff volatility, may be previews of the next major drawdown.
One final consideration is that while concentration risk is higher, it is just one of many risks investors need to consider. Other risks include:
We agree that the past several years of higher concentration have made passive investing riskier. This increased risk is certainly worth monitoring, and using active management or different indexes to help mitigate it might be worth considering. However, we stop short of calling this concentration a critical risk right now, highlighting that the S&P 500 index has outperformed 88% of active funds over a 10-year period. Wespath builds custom portfolios for institutional clients with both active and passive investments based on your needs and risk tolerance. Let’s discuss your portfolio construction and risk management.
We have updated our website with a new look and made it simple to navigate on any device.
We will continue to add more valuable information and features. Please let us know how we are doing.
P.S. For plan sponsors and plan participants, we have a new look for you too. Check out the Wespath Benefits and Investments website.