By: Joe Halwax, CAIA, CIMA
Managing Director, Institutional Investment Services
Did you know there have been over 30 new highs in the S&P 500 this year? Historically, there are 17 highs per year!
Investors often fear they are “buying the top.” But history shows that you shouldn’t necessarily be afraid of buying—even at new highs—especially if you’re someone with a long-term horizon who can weather sometimes extended periods of volatility.
It’s been a great start to 2024 for investors, and the second quarter looks much like the first: continued optimism on growth and slowly moderating inflation.
The “soft landing” scenario in the U.S. is now looking more like “no landing” scenario, meaning cooler inflation with no major slowdown in the economy. During the quarter, the forecast for Fed cuts again shifted lower, from three cuts and 75 basis points (bps) forecasted in April to just one cut and 25 bps expected, reflecting growing confidence in the no landing scenario. U.S. equities remain near all-time highs, with the S&P 500 up 15.3% year to date.
Strong returns for equities in Q1
While U.S. stocks ended up an impressive 4.3% for Q2, there was some interesting price action in the quarter. In April and May, we saw a 5.7% correction and recovery in the S&P500, followed by a 4% rally in June.
The April sell-off corresponded with higher inflation expectations and a move from 4.3% to a high of 4.7% for the 10-year U.S. Treasury yield. The S&P 500 has struggled recently when the 10-year yield is above 4.5%, as was seen in April and back in October 2023. But by the end of Q2, the 10-year had eased back down to 4.37%, which supported the June equity rally.
U.S. markets remain concentrated in growth and technology names. Both the S&P 500 and the tech-heavy NASDAQ have set new highs, while the more cyclically sensitive Russell 2000 Index of small-cap stocks lost 3.3% in Q2 and has returned just 1.7% year to date. Large-cap stocks continue to fare better in the backdrop of very loose fiscal but tight monetary policy as they have less need to borrow and may sit on cash reserves that can now provide interest income.
| Index | Q2 2024 | Year-To-Date |
| S&P 500 | 4.3% | 15.3% |
| MSCI ACWI ex-U.S. IMI | 0.9% | 5.3% |
| MSCI Emerging Markets Index | 5.1% | 7.4% |
| NASDAQ Composite Index | 8.4% | 18.6% |
| Russell 1000 Growth | 8.3% | 20.7% |
| Russell 1000 Value | -2.2% | 6.6% |
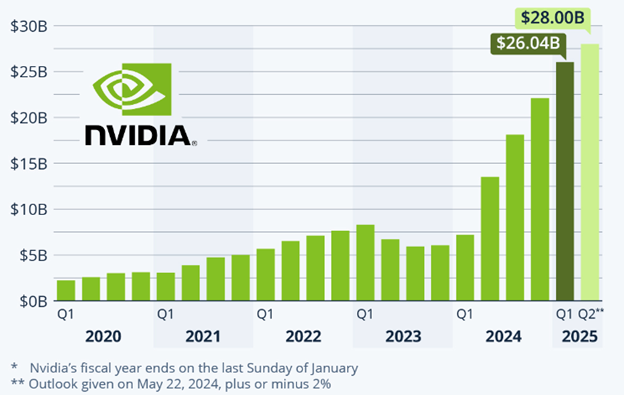
| Nvidia Corporation | 36.7% | 149.5% |
Why do U.S. stocks remain elevated?
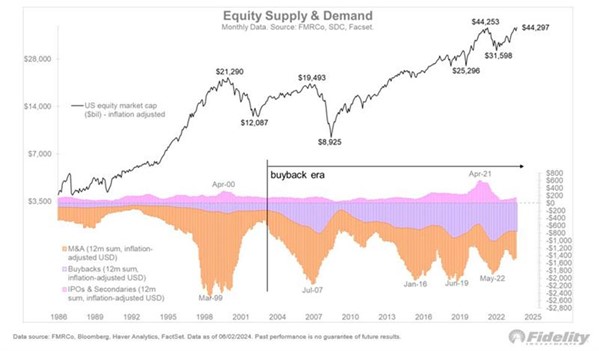
While the reason for large caps’ recent dominance may seem clear, the big question we’ve heard all year is how U.S. stock markets generally can remain in rally mode despite fewer expected rate cuts. Let’s look at a few themes:

Chart 2: Equity Supply and Demand
(As of June 2, 2024. Source: Fidelity Investments)

Taken together, we see that all of these themes are providing some inspiration for the U.S. equity market rally despite how much interest rate expectations have shifted this year.
Emerging markets notch solid quarter
International stocks were mixed for Q2, with emerging markets outperforming developed markets. The MSCI ACWI ex-U.S. IMI gained 0.9%. The MSCI EAFE Index was down -0.4%, while the MSCI Emerging Markets Index gained 5.1%.
Within the developed international markets, economic growth remains weak, but monetary easing has started, with the ECB cutting 25 bps in early June. Political uncertainty surrounding France’s parliamentary elections caused French equities to drop by 8% in June as the country shifts to a more populist stance.
Overall, global stock market breadth has improved in 2024, with a number of international markets at new highs and the MSCI All Country World Index recording an all-time high during Q2.
Yield curve continues to orbit 4.50%
Like the S&P 500, the ten-year U.S. Treasury yield had a roundtrip quarter. It started at 4.25%, peaking at 4.7% in April and 4.6% in May and then easing back to 4.25% to end June. Unsurprisingly, the Bloomberg U.S. Aggregate Bond Index was relatively flat on the quarter.
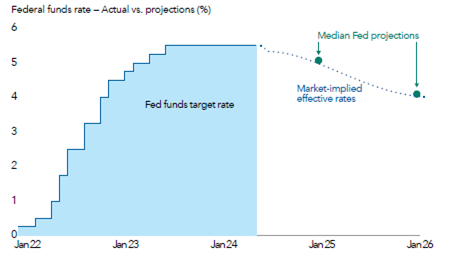
On June 12, the Federal Reserve met and provided a somewhat balanced stance on monetary policy, signaling just one rate cut for 2024. While many investors continue to push for a more aggressive policy, the Fed noted “inflation has eased over the past year but remains elevated” and “there has been modest progress towards the Committee’s 2% inflation objective.” The Fed’s “dot plot” of individual members’ rate expectations shows a more aggressive rate cut path for 2025 of five cuts or 1.25%.
Chart 4: Rate Cuts Are on the Horizon
(Source: Capital Group)
In the meantime, the yield curve remains persistently inverted, with the ten-year Treasury yield lower than the two-year Treasury yield for over two years now, the longest such period on record. The fiscal stimulus that occurred during and following the COVID pandemic is taking time to work its way through the economic system—not surprising given the magnitude of the stimulus. Once the Fed does pivot, the rate path described above should serve to normalize the yield curve.
Corporate fixed income has benefited from the stronger-than-expected economic growth, supported by a robust jobs market and consumer spending. Given this environment, corporate debt issuers are less likely to default on payments to bond holders. This, coupled with demand for yields that are much higher compared to the low yields of recent years, has caused spread compression.
| Index | Q2 2024 | Year-To-Date |
| Bloomberg U.S. Aggregate | 0.1% | -0.7% |
| Bloomberg Global Aggregate | -1.1% | -3.4% |
| Bloomberg Commodity Index | 2.9% | 5.1% |
As we head into the second half of the year, the market’s core questions will likely remain the same: Can inflation cool to levels closer to 2%? Will the Fed cut rates and, if so, by how much? Will U.S. earnings and AI/tech growth keep up? How will the U.S. and international elections and the ongoing conflicts in Gaza and Ukraine impact investors?
Right now, futures markets indicate there is a 70% chance of a 25 bps Fed rate cut in September, with 2.4 rates cuts expected by January 2025. All eyes will continue to focus on GDP and inflation in the U.S. to see if those expectations hold up.
We’re also gearing up for an election in November. That may create noise, and though historical data shows elections usually impact certain sectors at most while not having a major impact on broad indexes, it’s still another uncertainty to consider. We’ll see at the end of Q3 where things stand.
We have updated our website with a new look and made it simple to navigate on any device.
We will continue to add more valuable information and features. Please let us know how we are doing.
P.S. For plan sponsors and plan participants, we have a new look for you too. Check out the Wespath Benefits and Investments website.
