By: Karen Manczko
Director, Institutional Relationships
At Wespath, one of the most frequent questions we’ve been hearing lately is: “How will the upcoming presidential election impact my investments, and should I make any changes?” It’s natural for investors to feel uncertain as major events like elections approach, especially when we're facing a pivotal election year with huge stakes. As the election draws closer, it's important to understand how such events can influence the markets and what, if any, adjustments should be considered for your investment strategy.
We often emphasize that markets thrive on certainty. When uncertainty arises—such as during an election cycle—it’s expected that the markets will react accordingly. This response is a natural reflection of the market's sensitivity to unknowns, as investors seek stability and predictability. At the moment, several key issues currently being discussed by the candidates are causing some investors, both institutional and individual, to feel particularly anxious.
Since we don’t have a crystal ball to predict market movements, we can look to historical patterns to gain insight into what might be on the horizon. However, as we always say, historical returns are not indicative of future performance.
With that caveat acknowledged, historically, during election years, particularly when the race is close, the fourth quarter tends to experience heightened equity market volatility. Neuberger Berman, one of Wespath’s external asset managers, provides a helpful visual representation of these trends.
The chart on the left shows the S&P 500 index return in the second half of the year. In close election years (highlighted in the red box), the S&P 500 generally declines sharply in September, only to regain upward momentum a month or so later. Meanwhile, the chart on the right shows the median volatility of the S&P 500 for July through December between 1952 and 2023, indicating that volatility tends to increase in the fourth quarter during closely contested elections.

(Source: Neuberger Berman)
T. Rowe Price is another source of comprehensive research on presidential election years. T. Rowe Price compiled a chart that shows the average volatility of the stock market during a longer period of time around presidential elections. The blue bars show various time periods leading up to, and after, a presidential election year. The green bar shows non-presidential years. There are only two times when the S&P 500 volatility is greater in a presidential election year than other years: one year prior to the election and one month after the election.

T. Rowe Price also found that since December 31, 1927, whether the election is close or not, the S&P 500’s average return during presidential election years (11.0%) has nearly matched returns posted in non-presidential election years (11.6%).
These historical trends offer some perspective on how markets may respond to uncertainty during election years. But as we noted before, past performance can only tell us so much. Readers might note, for instance, that 2024 hasn’t been particularly volatile for stocks, even though we’re less than a month out from a too-close-to-call election. There can certainly always be other factors—including the U.S. Federal Reserve’s interest rate policies—that influence markets more than uncertain elections.
Beyond the impact of elections during election years, investors should also recognize that elections can influence government policy and laws, which can in turn impact the value of companies operating under those policies and laws. Still, throughout U.S. history, neither the election itself nor the party in power has had a significant long-term effect on market returns.
The chart below from Capital Group, one of Wespath’s external asset manager, illustrates the hypothetical growth of $10,000 invested at the beginning of an election year, showing how the market rises and falls regardless of which party occupies the White House, with no clear winner or loser over time. In fact, if we calculate the average 10-year annualized returns by party, the data reveals that, on average, markets have performed similarly under both Republican and Democratic administrations.

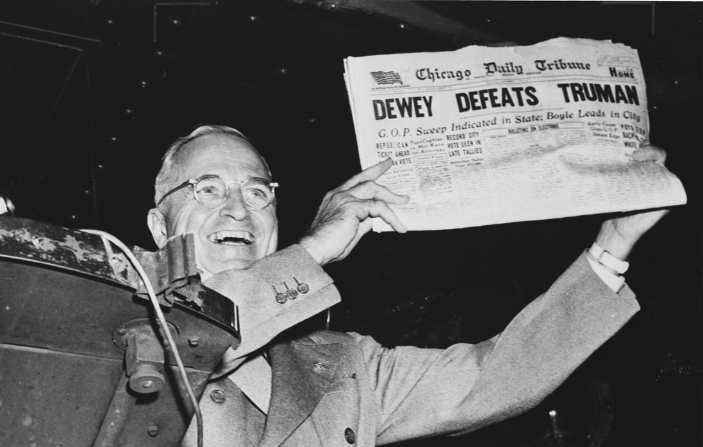
I’d like to conclude with a bit more historical perspective. The 1948 election between Harry S. Truman and Thomas E. Dewey is a very memorable moment in U.S. political history. Dewey was widely expected to win, and in fact, the Chicago Tribune famously—and prematurely—ran the headline “Dewey Defeats Truman.” As we now know, Truman was the victor, and the erroneous headline has since become a lasting symbol of political unpredictability and a famous photo.

(Source: By United Press, 1948; Records of the U.S. Information Agency National Archives)
The same lesson applies to your investments during uncertain times. While we might expect some market volatility around the election, as long-term investors, we don’t make shifts based on anticipated election outcomes. Just like the 1948 election, nothing is certain until the final vote is counted. Staying focused on long-term strategy is key.
We have updated our website with a new look and made it simple to navigate on any device.
We will continue to add more valuable information and features. Please let us know how we are doing.
P.S. For plan sponsors and plan participants, we have a new look for you too. Check out the Wespath Benefits and Investments website.